
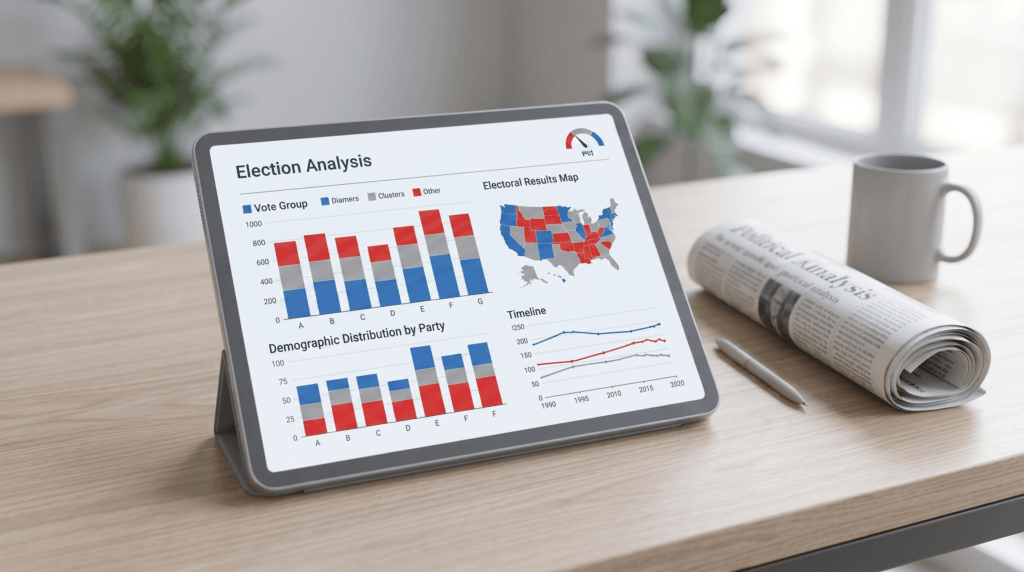
Cook Political Report Election Forecast: A Guide To Non-Partisan Tracking

In the world of political forecasts, knowing who’s crunching the numbers can make all the difference.

Originally founded back in 1984 by Charlie Cook, the Cook Political Report brings a legacy of expertise and insight that’s hard to match.

Today, it’s Amy Walter steering the ship, ensuring the same commitment to precision and clarity remains at the core of this trusted resource.

Everyday political chit-chat often gets tangled up in emotional storms and catchy media vibes.

Doesn’t it feels like every headline is trying to tug at our emotions in different directions, right?

But that noise can make it tough to see where the real tides are turning.

That’s why cutting through the chaos with objective, data-backed insights is so essential and that is exactly what the Cook Political Report offers.

Their forecast isn’t just another voice in the media frenzy. It stands apart by maintaining a laser focus on the hard facts and figures that define the political landscape.

They offer an approach that sidesteps emotional narratives, choosing instead to track cold, hard numbers like voting patterns and demographic shifts.

It’s a great lifeline for anyone trying to navigate the ever-changing seas of political news.

When you’ve got objective data, suddenly things start to make a lot more sense because the drama gets filtered out, leaving a clearer picture of what’s truly going on.

Knowing this helps make sense of complex political realities and arms you with the knowledge to separate statistical facts from mere sensationalism.

That’s the power of a report dedicated to keeping things real and grounded.

Data Over Rhetoric

When it comes to getting a grip on election possibilities, data is king.

Sure, news stories might grab you with flashy narratives and dramatic twists, but when projecting political outcomes, it’s the hard numbers that tell the real story.

The Cook Political Report takes a refreshing route by zeroing in on these unshakeable figures, offering a reality check that seriously shakes up daily talking points.

It’s wild how historical voting patterns can serve as handy roadmaps for the future.

By looking at how communities have swung in past elections, the Cook Political Report can forecast leaning trends without getting distracted by the latest news buzz.

This kind of analysis gives both insiders and casual observers a chance to peek behind the curtain to understand potential political shifts.

Another crucial element is acknowledging demographic shifts such as who votes where really impacts how elections play out.

The Cook Report digs into these changes, showing how these shifts can influence voting behavior and reshape political landscapes over time.

Let’s talk about polling math. It’s like the secret sauce in election forecasting.

It involves taking multiple polls, adjusting for biases, and coming up with a clearer view of what’s happening beneath the surface-level media coverage.

While it doesn’t always reflect every twist and turn of the news cycle, it provides a more stable ground to forecast from.

By focusing on these elements, you’re equipped to handle the political noise with confidence.

The emphasis on data over narrative offers a more dependable guide through the electoral maze, helping you tune out the noise and focus on what’s truly crucial in understanding shifts in political power.

The Partisan Voter Index (PVI)

Ever wanted a straightforward way to navigate the tangled web of political leanings? That’s where the Partisan Voter Index (PVI) comes in handy.

Think of it as your cheat sheet for understanding how districts vibe politically compared to the rest of the nation.

So what exactly is PVI? It’s a metric that takes a deeper look at how districts vote, comparing them to a national benchmark.

This simple scale strips away the confusion of surface-level claims by showing you the underlying party leanings of a district.

By focusing on longstanding voting behavior, it sheds light on whether a district is tilting more Republican or Democratic than the rest of the country.

Having this metric is like holding a map that guides you past misleading or superficial political rhetoric.

You get to grasp the deeper partisan tendencies that often predict how a district might swing.

This understanding is key for anyone trying to sift through political jargon and noise.

The PVI doesn’t just measure today’s attitudes, it highlights consistent patterns over time.

With this insight in your toolkit, when voting, this data will cut through the political fog that becomes way less daunting.

Using PVI also means you can confidently gauge where the real political battlegrounds are.

It’s the secret weapon for those who want a clear, objective view of the political landscape, empowering readers to make informed decisions in a sea of opinions and narratives.

Rigorous Race Ratings

Navigating political predictions involves sifting through a lot of noise, but the Cook Political Report makes it simpler with its rigorous race ratings.

These ratings are like a trusty guidebook, classifying political races on a clear, easy-to-follow scale that ranges from totally safe seats to those on a knife-edge—better known as ‘toss-ups.’

This system provides a quick snapshot of where things stand across the political spectrum.

The methodology behind these ratings is all about objectivity. Analysts dive into the data with precision, examining a myriad of factors including historical trends, demographic changes, and political dynamics.

This analysis cuts through the surface hype, giving a grounded view on the actual state of play in each race.

Understanding these classifications can be a game-changer.

Safe seats indicate a strong, long-standing partisan preference, whereas ‘toss-up’ implies the outcome is anyone’s guess, making them the hotspots to watch.

These ratings are crucial for anyone wanting an unfiltered sense of where power might shift in the legislative landscape.

Independent thinkers and researchers value these race ratings as they provide reliable markers to evaluate political change.

It helps them maintain a balanced perspective, free from partisan spin.

By focusing on these ratings, you can tune out sensationalist narratives and understand the true dynamics at play.

Gleaning insights from these ratings means you’re equipped with a clear view of the political scene’s balance of power, enabling a deeper understanding of how elections could reshape the country’s governance.

By getting past the noise and honing in on what really matters, you are empowering to stay ahead in navigating electoral changes.

By getting past the noise and honing in on what really matters, you are empowered to stay ahead in navigating electoral changes.

Ready to dive into the numbers yourself? Head over to the Cook Political Report to explore the live ratings, track district data, and put these insights to work.

Leave a Comment